Average First Semester Grade (Out of 20)
10.9
Average Second Semester Grade (Out of 20)
10.7
Average Final Semester Grade (Out of 20)
10.4
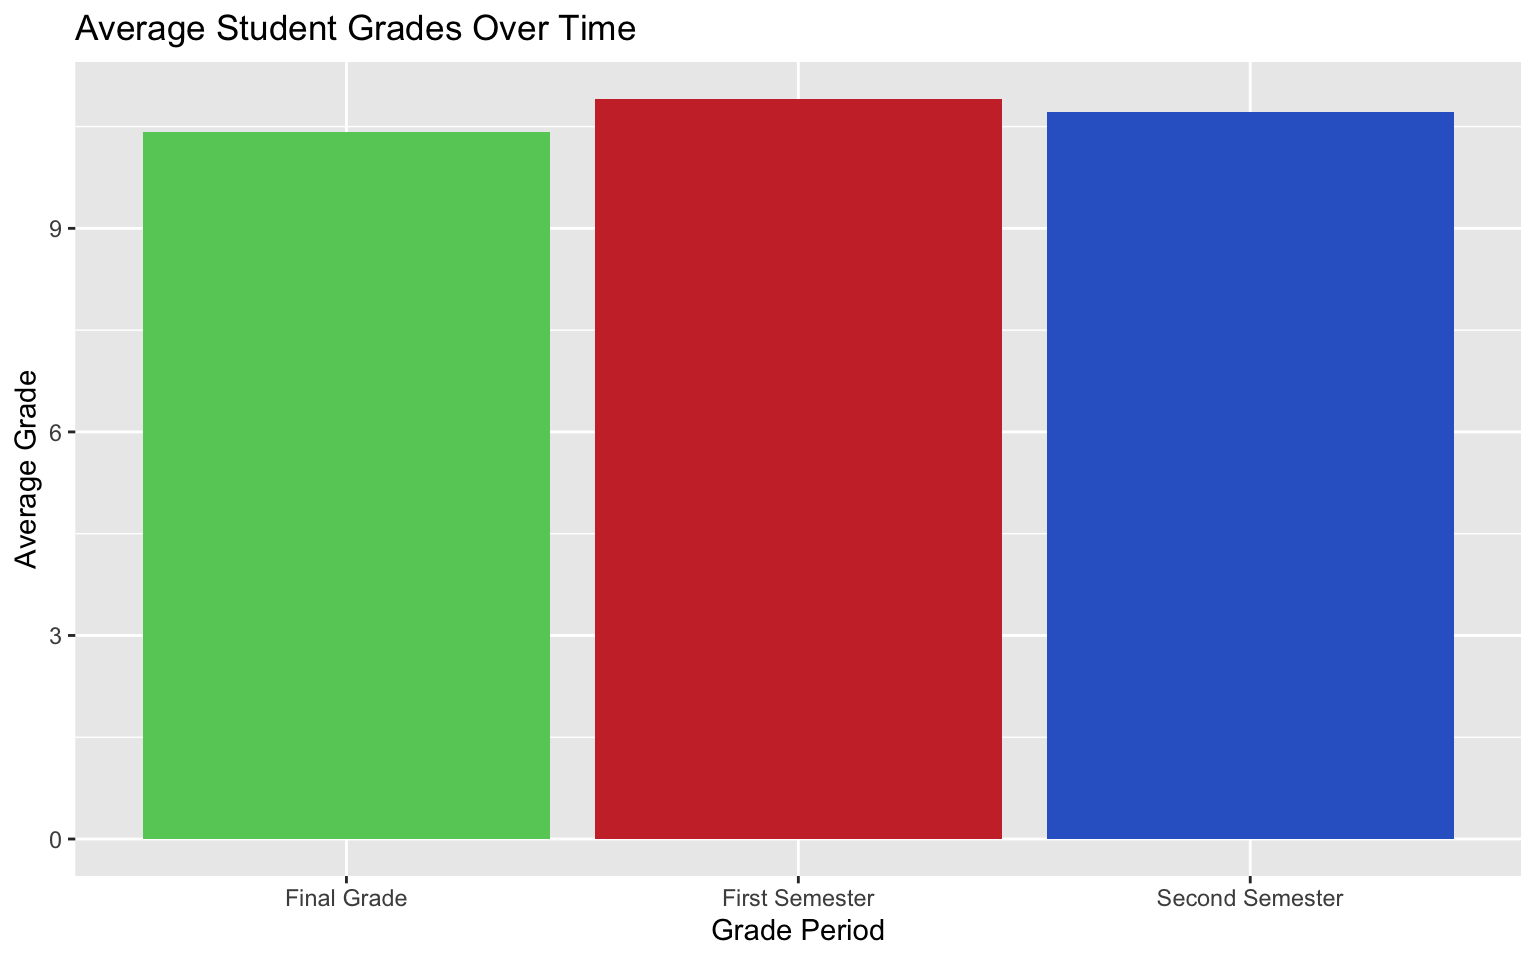
| Grade | Average | Lowest | Highest |
|---|---|---|---|
| First Semester | 10.90886 | 3 | 19 |
| Second Semester | 10.71392 | 0 | 19 |
| Final Grade | 10.41519 | 0 | 20 |
This section explores variables that students might have some control over that connect to school habits, academic choices, and goals.
This section explores variables that are related to a student’s personal life and wellness.
This section explores variables that students may have less control over.
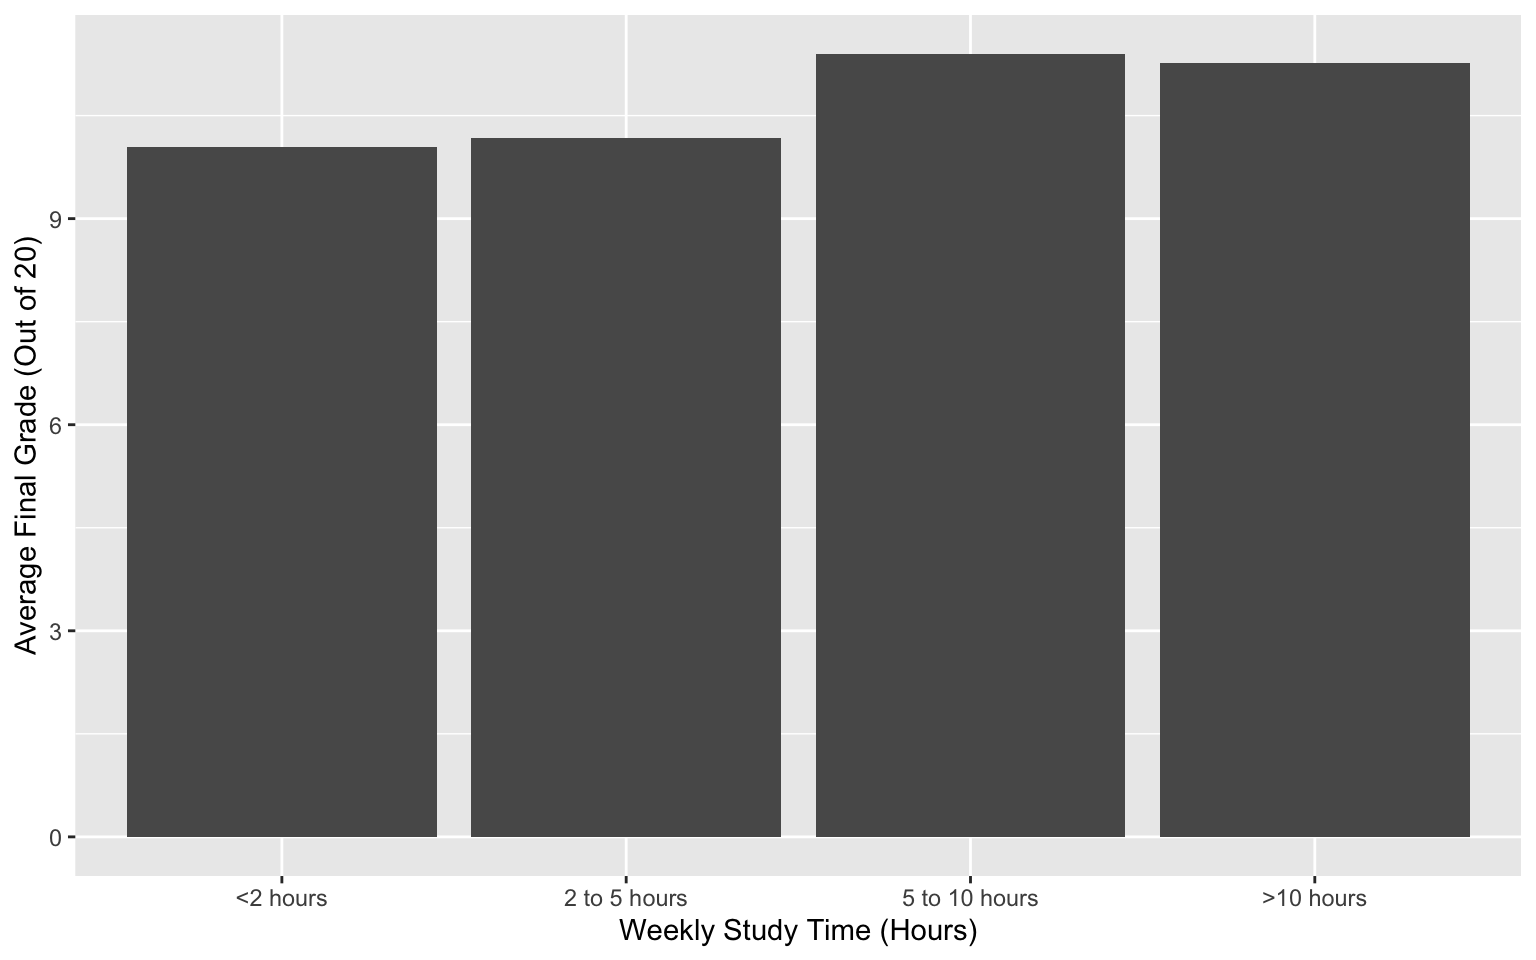
For this project, I was mainly interested in how specific variables, such as weekly study time, internet access, travel time to school, family relationships, and more influence a student’s performance on their math test scores as I plan to become a future math teacher.
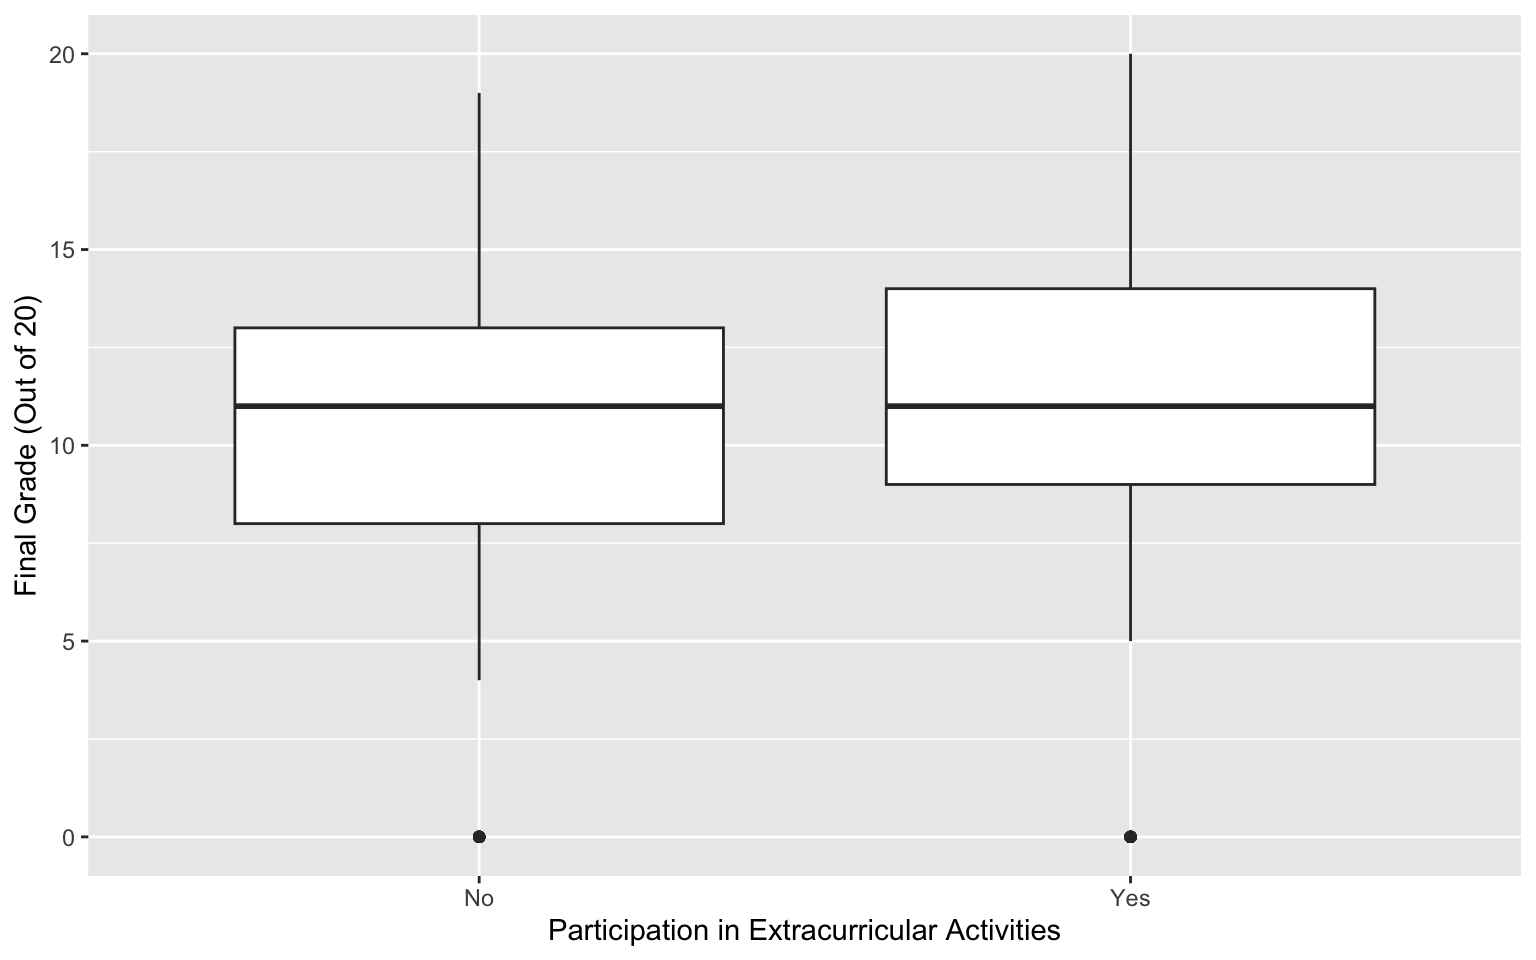
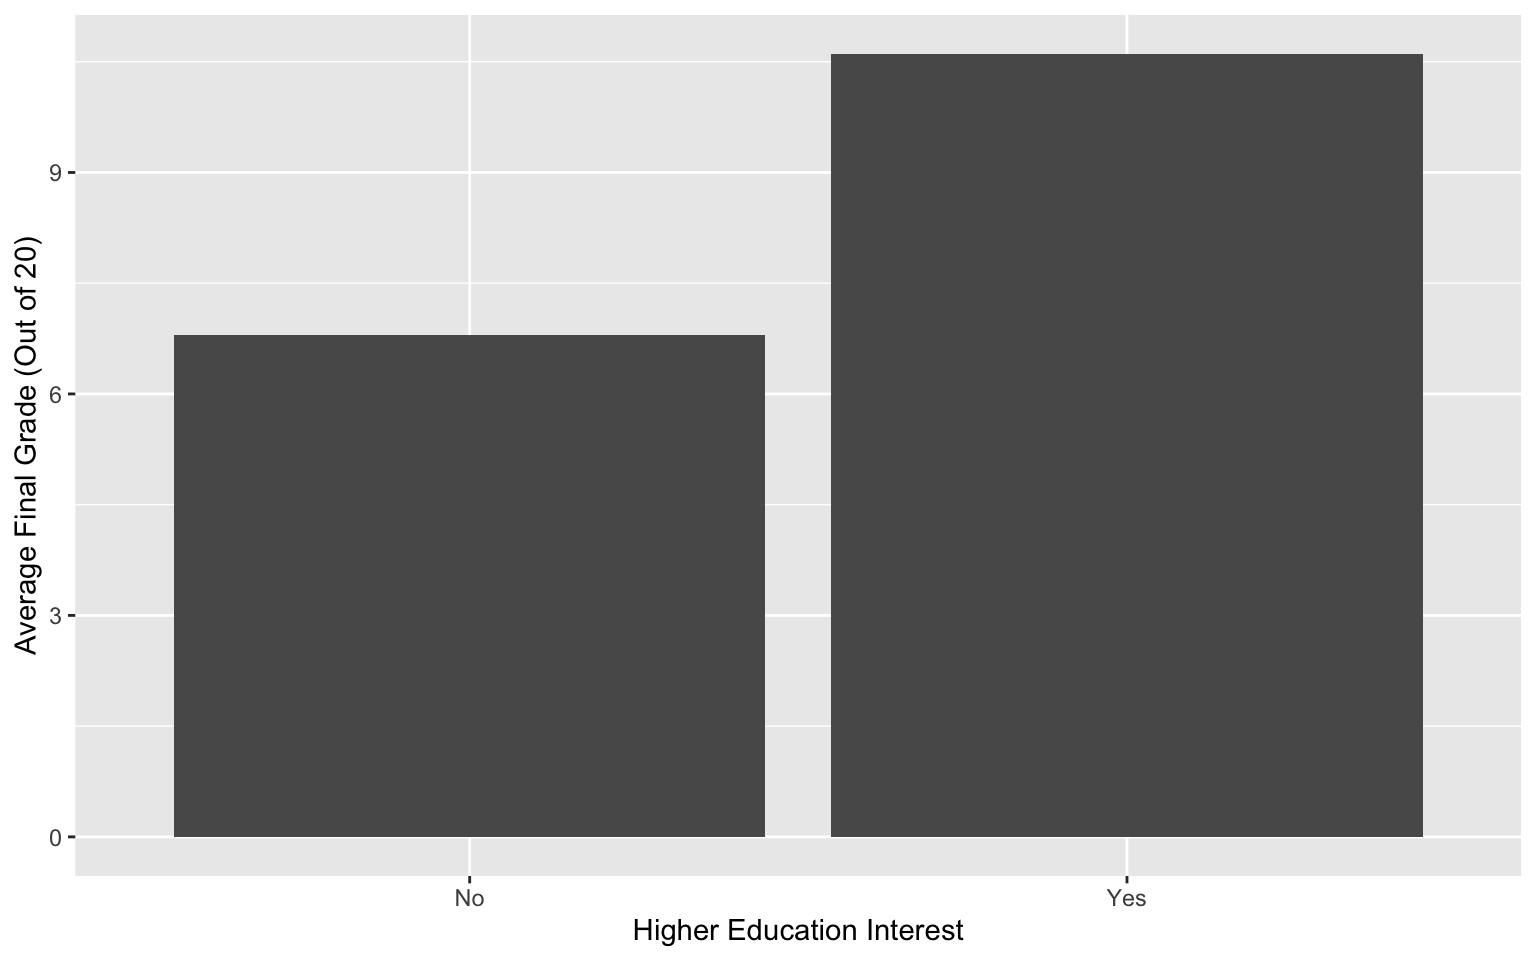
I first found that the weekly study time of 5 to 10 hours resulted in the highest average final grade. I found this quite interesting as it had a higher average than over 10 hours of studying. Students who participated in extracurricular activities had a higher final grade compared to students who did not participate. There was a drastic difference in the average final grade compared to a student’s interest in higher education, where students who said they had an interest had a greater average final grade.
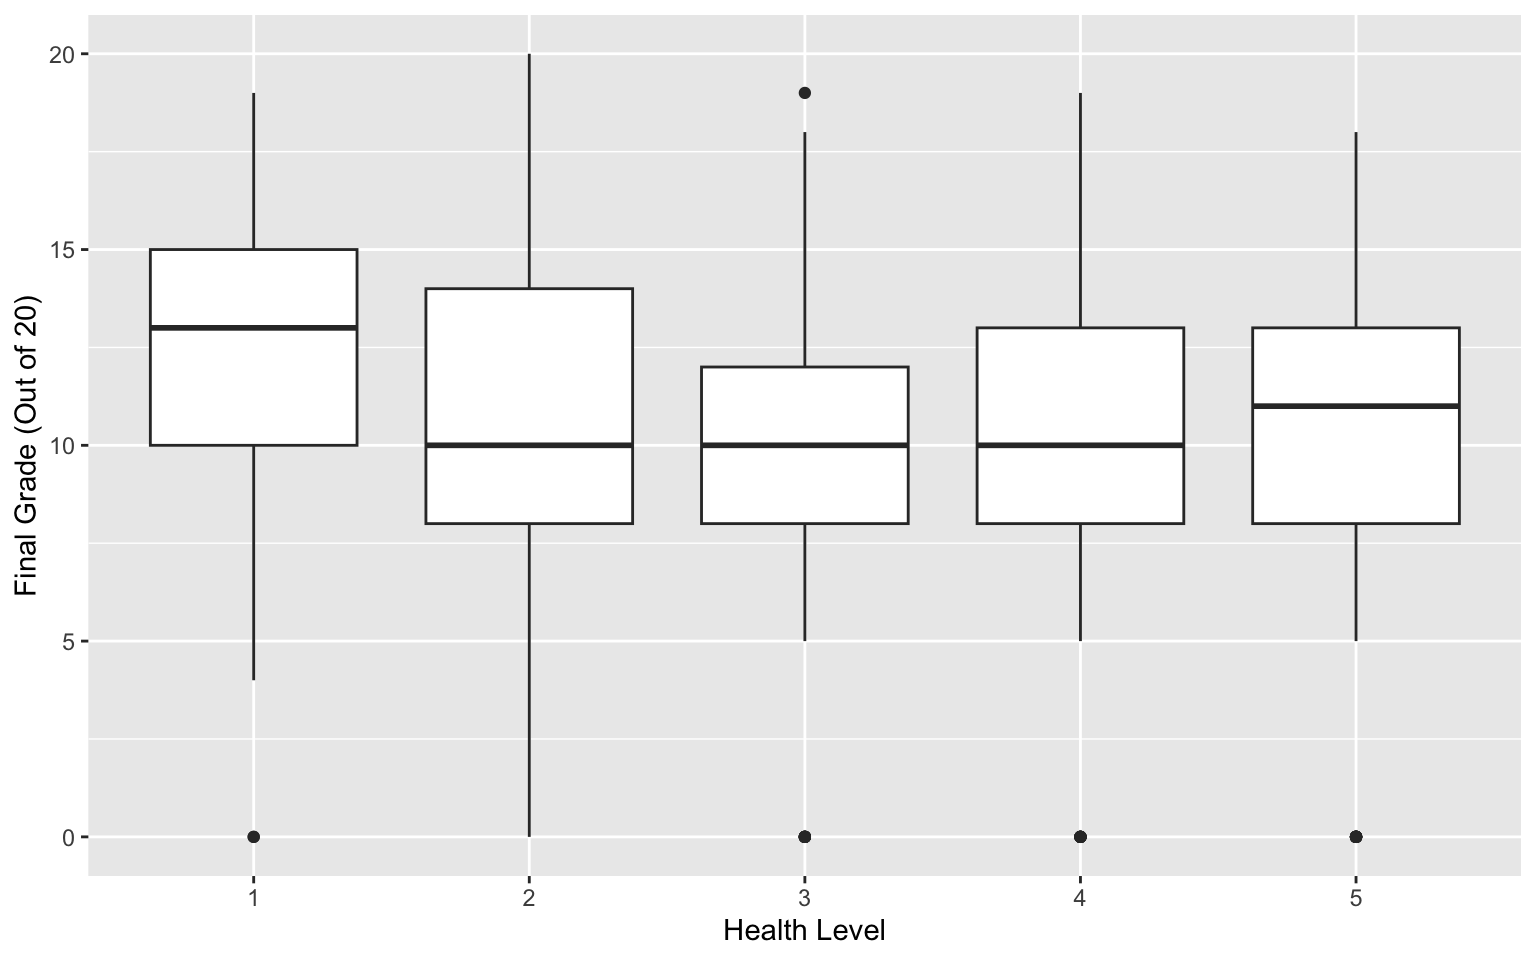
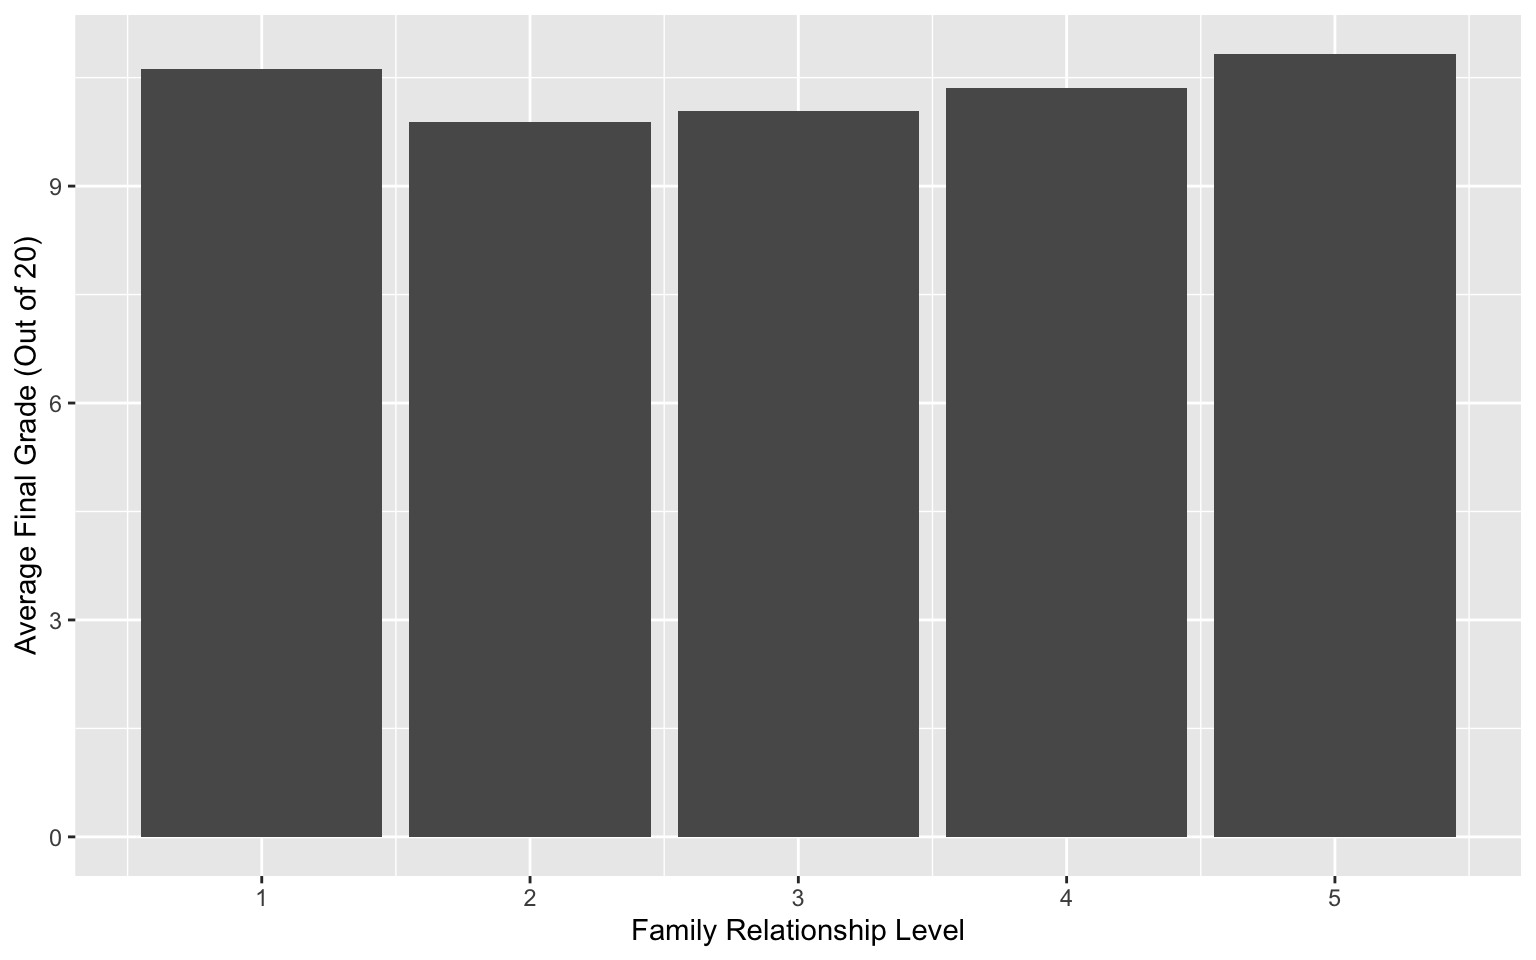
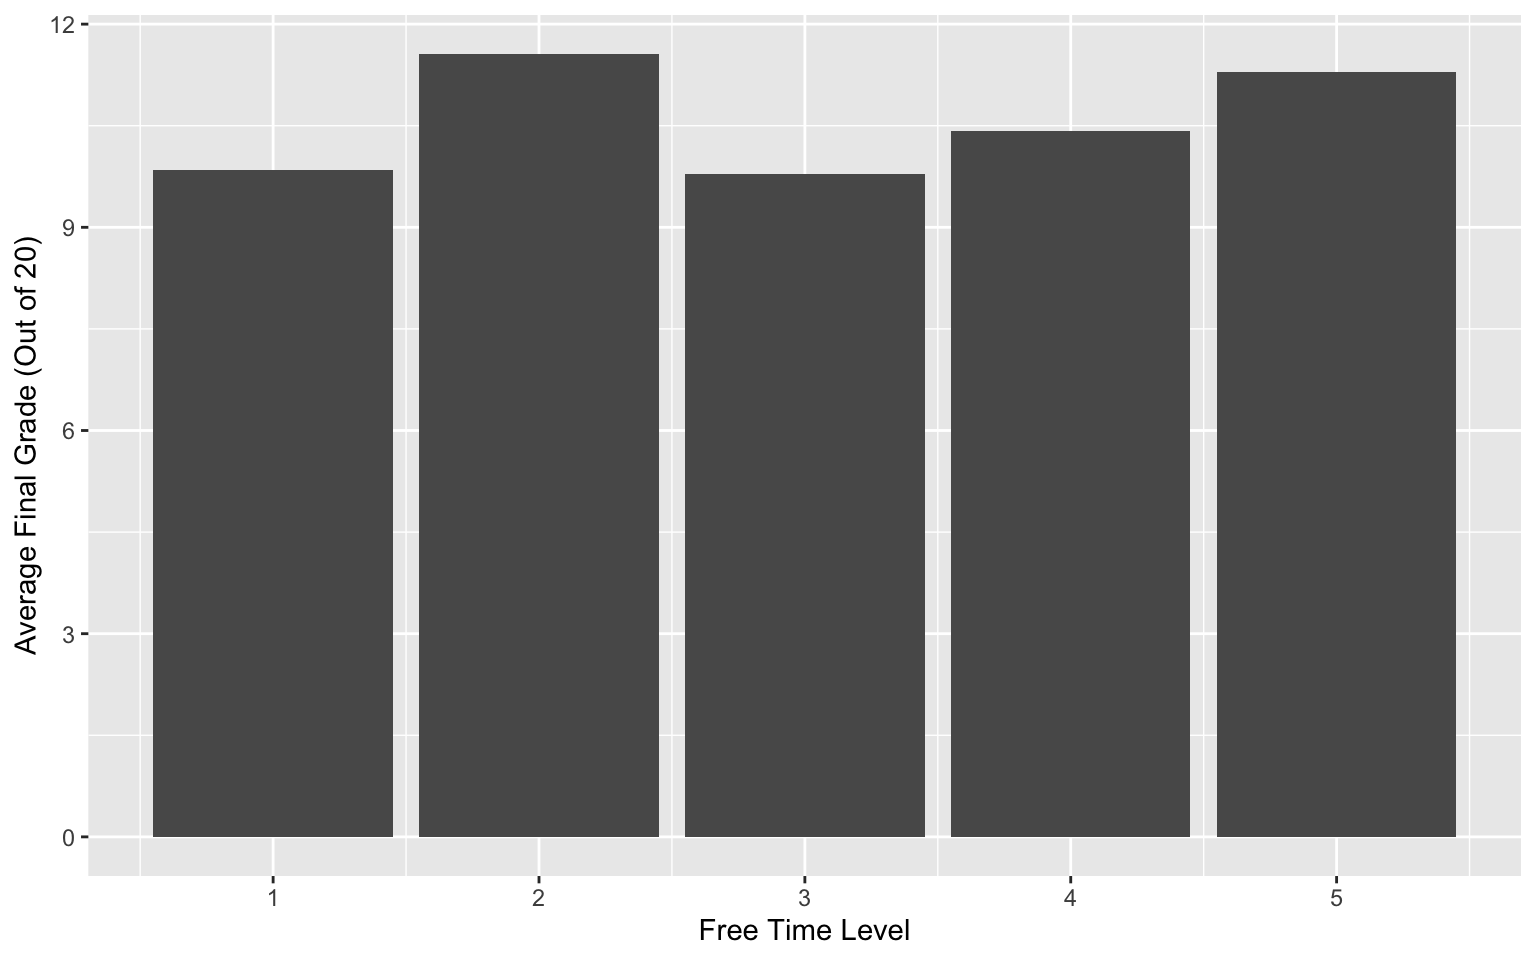
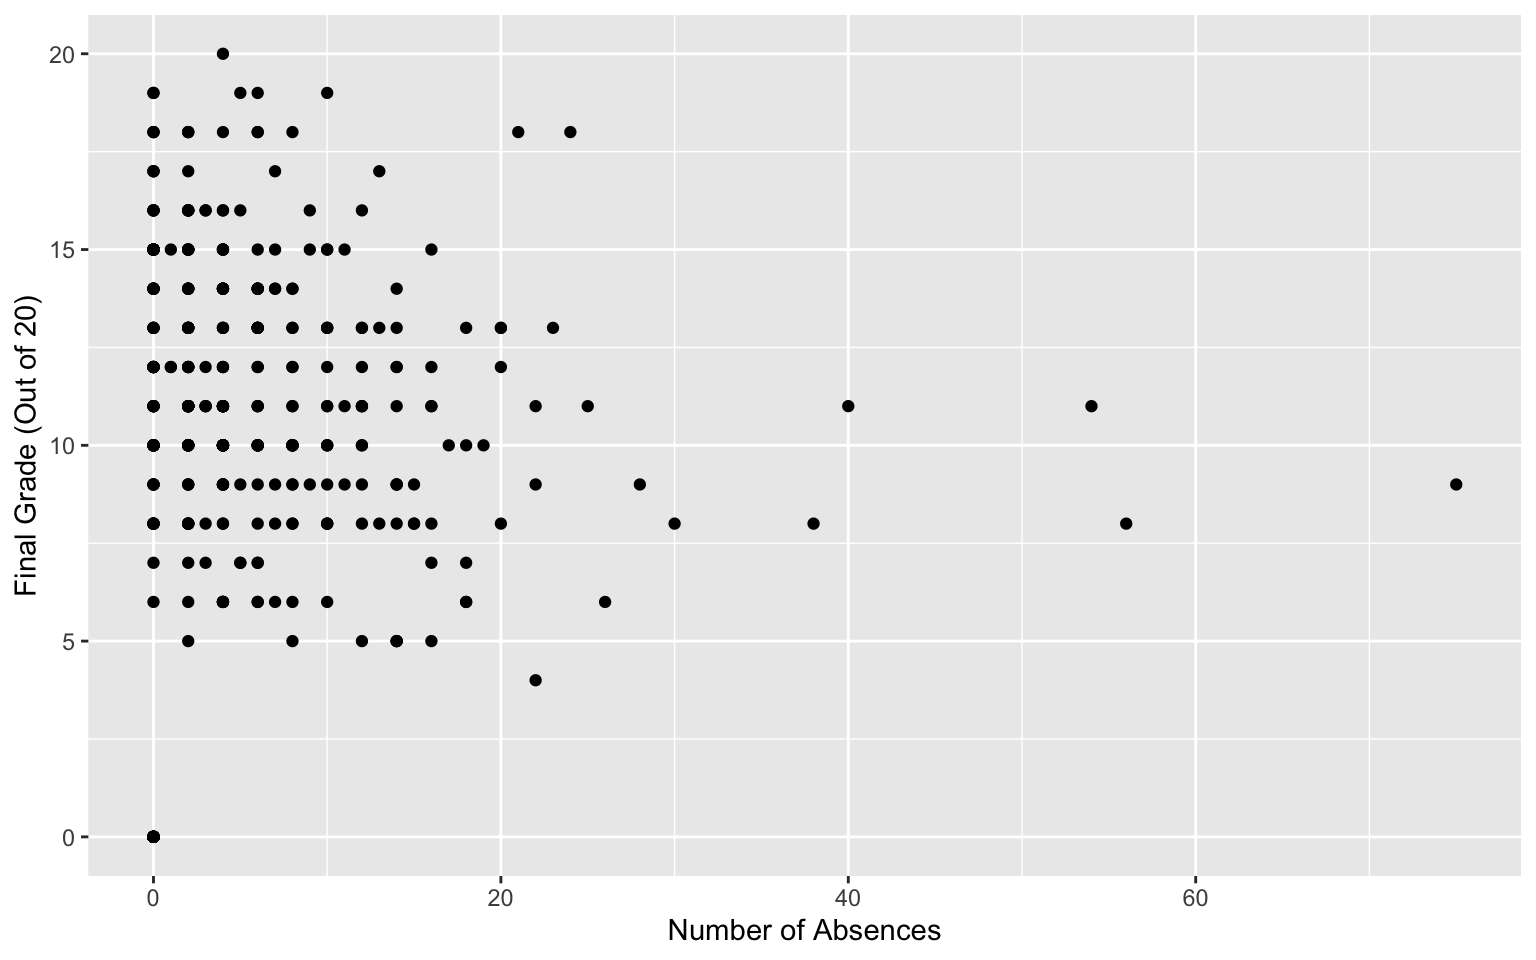
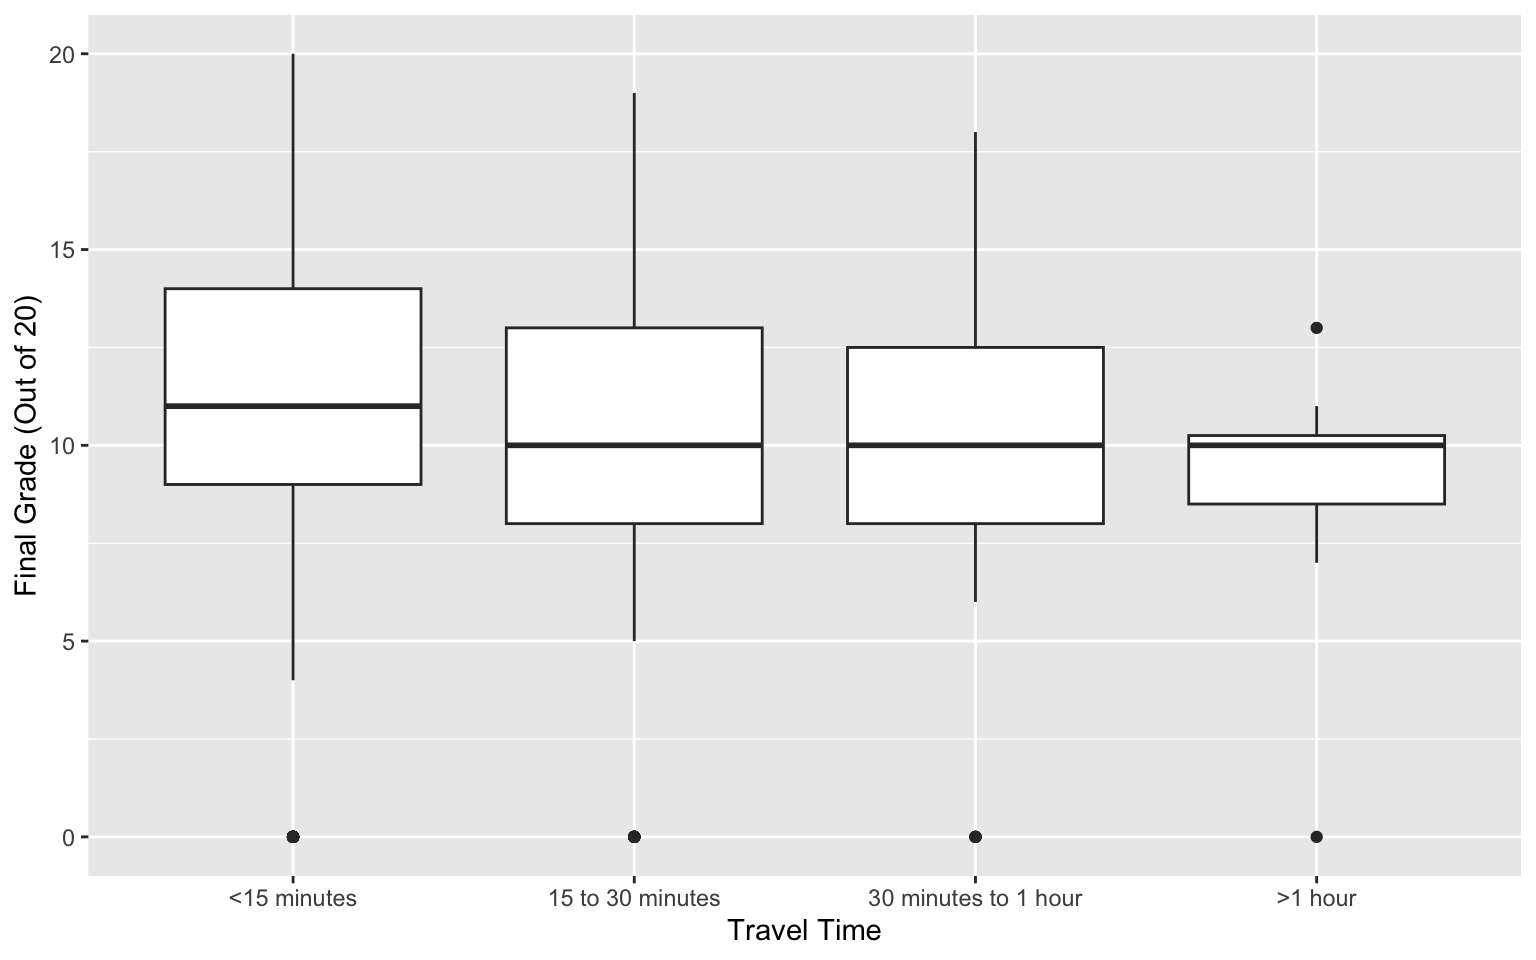
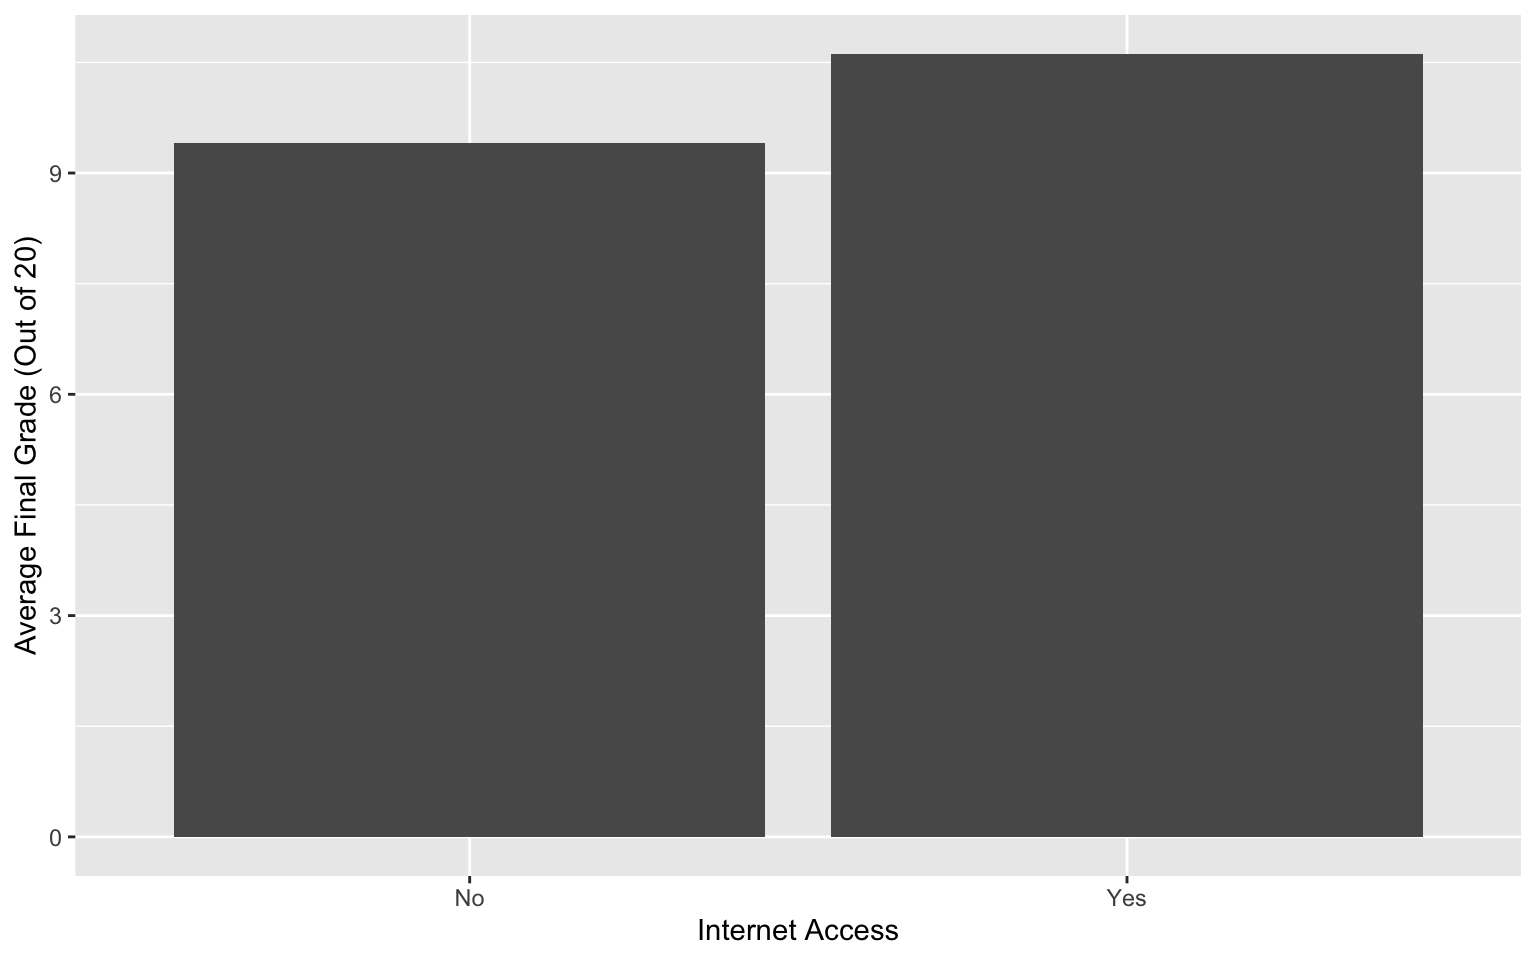
One thing I found quite weird was the students who had the lowest reported health level performed usually greater on the final grade score. I did not really see a student’s family relationship or free time level affecting the average final grade score that much. However, the travel time to school had a big impact on the final grade score as the farther away a student was, the lower the final grade was. Internet access did result in a higher average final grade and the smaller number of absences results in usually a higher final grade.
This project can overall help me better understand these patterns and aid me in becoming a more effective future math teacher by showing that student performance may be influenced by outside factors that students might or might not have control over. This puts emphasis on that students may enter a classroom with different experiences and levels of background and support. Knowing this can help me plan lessons that can provide clear instruction and multiple ways for students to learn so all students can have the opportunity to succeed no matter what their background is. It also shows the importance of encouraging students helpful study habits and overall creating a classroom environment where every student is capable of succeeding.
Additional ResourcesFor my project, I used the dataset from the website UC Irvine. Relevant additional resources that can be used to continue exploring topics related to the dataset I used are:
- Test Scores, Class Rank and College Performance: Lessons for Broadening Access and Promoting Success
- Race and Ethnic Differences in College Achievement: Does High School Attended Matter?
- Student Exam Scores and Study Habits Dataset
The first link listed above provides additional resources that can help one better understand how specific factors of a student in high school influence their performance in college. It also provides a lot of data and graphs that show students’ academic performance compared to their test scores as well as their high school rank compared to their economic status.
The second link above provides additional resources that show a person’s race compared to their first semester grade point average for four Texas Public Universities. Within the dataset I chose for this project, it did not include a variable for race/ethnicity so I was unable to provide visuals to help one better understand someone’s race/ethnicity compared to their average math score. Therefore, I think the second link can provide helpful data to analyze when wanting to see someone’s race, class rank, and test score compared to their first semester grade point average in college.
Lastly, the third link provided above, is a dataset I found on Kaggle that shows how factors such as hours studied, class attendance, access to learning materials, extracurricular activities, sleep hours, previous exam scores, motivation level, internet access, and tutoring sessions influence their final exam score. I overall found this dataset to be very helpful if one wants to see how additional variables influence a student’s performance on their final exam score.